Observability
DSAgt logs traces to one MLflow store: the shared tracking server MLFLOW_TRACKING_URI names, or, when it is unset, a serverless SQLite file at <project>/mlflow.db, which keeps a project self-contained in its directory.
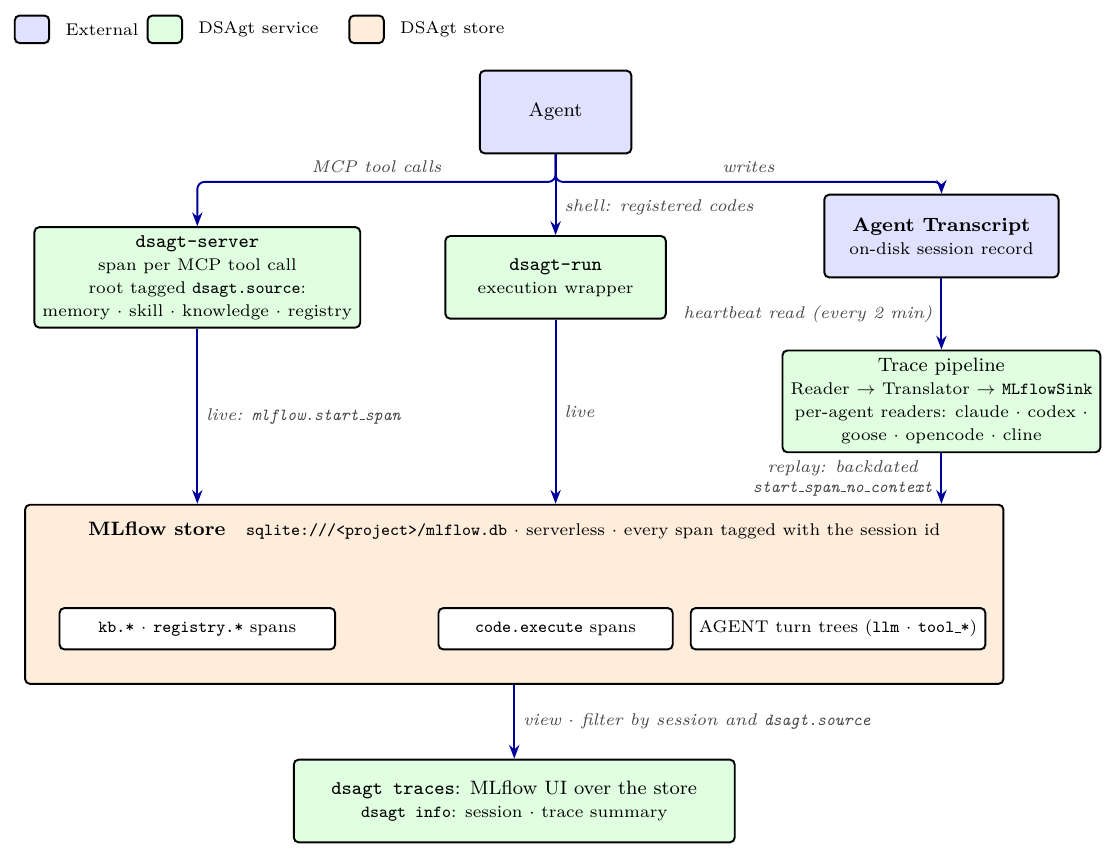
To view in the MLflow UI:
dsagt info <project> prints the resolved tracking URI and a session/trace summary. The tracking URI is MLFLOW_TRACKING_URI when set in the shell, else the sqlite:///<project>/mlflow.db default. The experiment is dsagt-<8 hex>, hashed from the project directory so two users' demo projects never collide on a shared server; set mlflow.experiment in .dsagt/config.yaml to choose a name. The project name is on the experiment's description and its dsagt.project tag.
Logging to a shared tracking server
Export MLFLOW_TRACKING_URI before dsagt init; the value is written into the agent's MCP config, so the CLI, the MCP server and its dsagt-run children all log there instead of the local file. Credentials are never written into a project or an agent config:
MLFLOW_TRACKING_TOKEN(Bearer) orMLFLOW_TRACKING_USERNAME/_PASSWORD: read by the MLflow client itself.MLFLOW_TRACKING_API_KEY: for a server behind an API gateway that authenticates on anX-API-Keyheader (Kong answersWWW-Authenticate: Key); DSAgt adds the header through MLflow's request-header plugin.
In this mode dsagt traces prints the remote deep-link, since the viewer is the remote server, and dsagt info reads from the remote store.
Two consequences of the URL being written into the agent config at init:
- Change the server by re-running
dsagt init. Exporting a differentMLFLOW_TRACKING_URIlater moves the CLI but not the MCP server, whose config still carries the earlier value. - Codex and Cline start their MCP children from the config's env block alone, so a key exported in a terminal never reaches
dsagt-serverunder those agents. Put it in~/.config/dsagt/env(KEY=VALUElines, mode 600):dsagt-serverand thedsagtCLI load it at startup for any key the shell did not set. The file is in$HOME, never inside a project or an agent config, the same placement as~/.netrc. It works for every agent, and forEMBEDDING_API_KEYtoo.
Trace sources
DSAgt reconstructs traces from what the agent writes to disk.
- DSAgt spans (live). DSAgt instruments its own code and emits spans directly to mlflow as it runs.
- Agent traces (post-hoc). The MCP server periodically reads the agent's own on-disk session transcript, translates it to a canonical trace shape, and writes it to the same store via the MLflow sink, recovering prompts, responses, and tool calls.
Trace Coverage
| Source | Span type | Contents |
|---|---|---|
| Knowledge base | kb.search, kb.embed, kb.index_search |
Per-phase timing trees |
| Code executions | code.execute |
Exit code, duration, file counts, truncated stderr. Full payload in trace_archive/<record_id>.json |
| Registry events | registry.save_code_spec, registry.reconstruct_pipeline |
Span metadata |
| Agent traces | one AGENT subtree per turn (llm / tool_<name> children) |
Prompts, responses, tool calls, and token usage where the transcript carries them |
Agent trace coverage
Agent traces are reconstructed from each agent's on-disk session record. A per-agent reader and translator runs for every supported agent (claude, codex, goose, opencode, cline), the same way. Fidelity is capped by what the transcript persisted: token counts and timing appear where the agent recorded them.
Every span carries the project's session id for filtering in the MLflow trace view.
The periodic pass runs every 45 seconds inside the MCP server. Each pass reads new transcript records, translates the completed turns to the canonical trace, and passes them to the MLflow sink and, when episodic memory is on, to the memory indexer.
Try it
dsagt init            # follow the prompts: name it `demo`, then pick your agent
dsagt start demo      # run a prompt or two, then exit the agent
dsagt traces <project>
Open MLflow UI to see both feeds in one store: DSAgt's own kb.* / code.execute spans and the per-turn agent traces recovered from the transcript. dsagt info demo prints the same session/trace summary from the command line.