Provenance
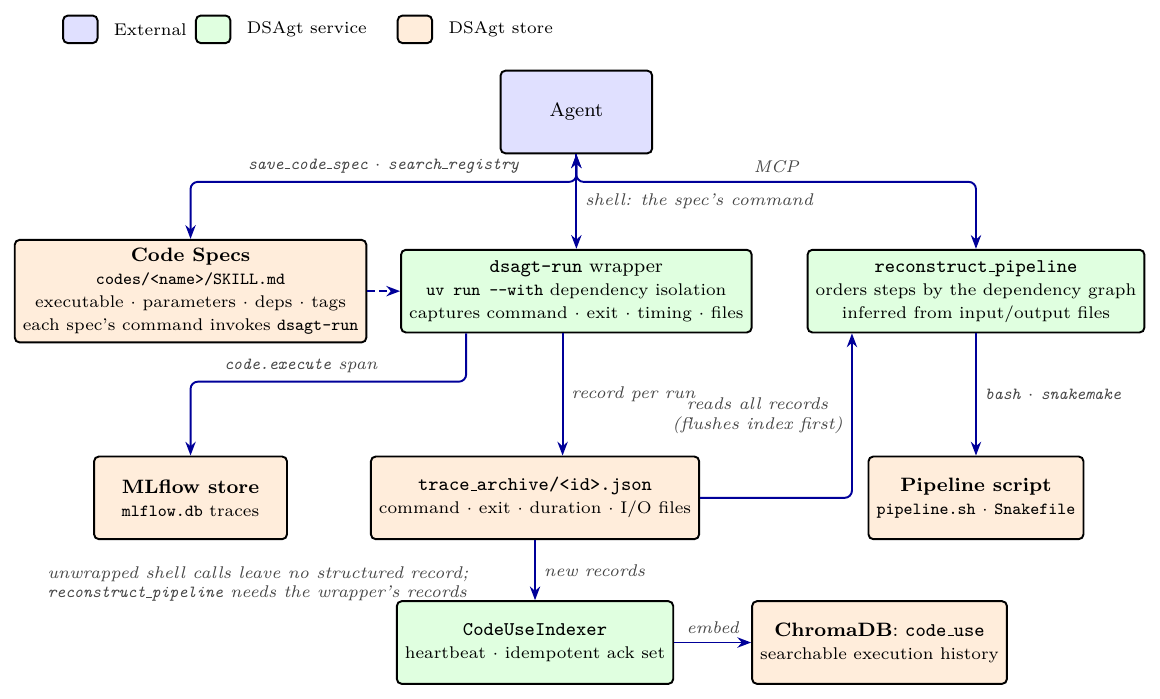
DSAgt records data operations as reproducible, auditable steps. The agent registers a code, a CLI executable, and every run of that code is wrapped for provenance capture, so the pipeline can later be reconstructed from the record.
Codes
Registered codes are CLI executables defined as skills. The agent registers new codes via the MCP server's save_code_spec tool and finds existing ones via search_registry.
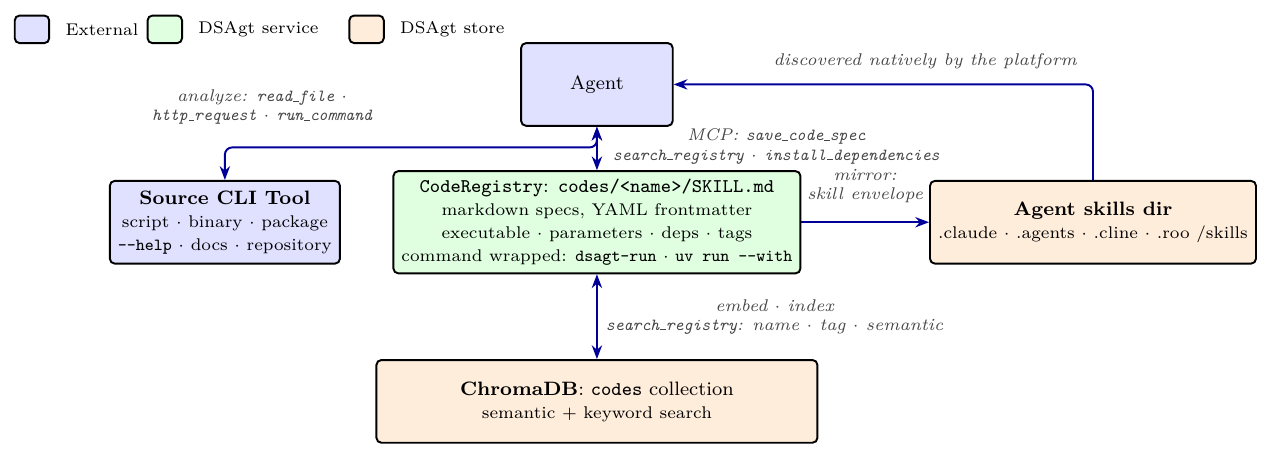
A code spec includes:
- A YAML frontmatter block describing the executable, parameters, dependencies, and tags.
- A markdown body with the exact runnable command, usage, and notes for the agent.
Example code spec (skills/csv-summary/SKILL.md):
---
name: csv-summary
description: Summarize a CSV (columns, row count, null counts, numeric stats). Use when profiling a tabular dataset.
executable: dsagt-run --code csv-summary -- python skills/csv-summary/scripts/csv_summary.py
parameters:
  file:
    type: string
    required: true
    cli: positional
    description: Path to the CSV file
dependencies: []
tags: [csv, profiling]
---

Run this registered code with the exact shell command below.
DSAgt wraps every registered code with dsagt-run for provenance capture and uv run --with for Python dependencies, so the agent calls a code by its stored command and the environment is handled for it. The base skills' scripts and the aidrin CLI are registered as codes at dsagt init, indexed for search.
Execution record
Every registered code runs through the dsagt-run wrapper. For each call it records the command, arguments, exit code, duration, input and output files, and truncated stderr to <project>/trace_archive/<record_id>.json, and, once the command has exited, a detached python -m dsagt.commands.log_trace process logs a code.execute span with the run's own start and end times to the trace store, so the wrapper adds about 0.2 s to a command. An error from that process is appended to .dsagt/run_trace.log. The MCP server incrementally indexes those records into the code_use collection, so past executions are searchable.
Claude Code ends a shell command that outruns its timeout and kills the process group 1.5 s later. dsagt-run forwards the signal and records a run whose child ends inside that window; a child still running is killed along with it and that run leaves no record. Two limits decide when: BASH_MAX_TIMEOUT_MS, ten minutes, caps what a call may ask for, and BASH_DEFAULT_TIMEOUT_MS, two minutes, is what a call that asks for nothing gets. Raise both for the project: {"env": {"BASH_DEFAULT_TIMEOUT_MS": "3600000", "BASH_MAX_TIMEOUT_MS": "3600000"}} in .claude/settings.json.
The wrapper is the point of code-mediated data access. A direct shell or editor call leaves only what the agent's transcript captures about the command and its output, a partial, agent-curated account; the dsagt-run record holds the exit code, timing, and input and output files, which is what reconstruct_pipeline reads, so a direct call breaks reconstruction.
Pipeline reconstruction
The on-disk execution records are the canonical provenance chain. The agent calls reconstruct_pipeline to render the trace archive as a reproducible bash script (format="bash") or Snakemake workflow (format="snakemake"). It flushes the latest records into the searchable index first, then lists the steps in the order they ran, each annotated with its input and output files and the steps it depends on; a run that exited non-zero is kept as a comment, and paths under the project are written relative to it. The files come from the spec's parameter roles (role: input or role: output on a parameter), which dsagt-run reads off the command line on every run; a spec that declares no roles has its files inferred from the arguments that exist when the command starts.
Try it
export SMOKE_DIR="$(pwd)/tests/smoke_test"   # a small built-in sample script + CSV
dsagt init            # follow the prompts: name it `demo`, then pick your agent
dsagt start demo      # launch the agent in the project
Then, in the agent (replace $SMOKE_DIR with the absolute path you exported):
-
Register the CLI utility at
$SMOKE_DIR/csv_summary.pyas a code namedcsv-summary. -
Run the
csv-summarycode from the registry on$SMOKE_DIR/data/samples.csvand summarize the columns. -
Reconstruct the pipeline as a bash script.
Afterwards, inspect the trail: